Visualizing Process
|
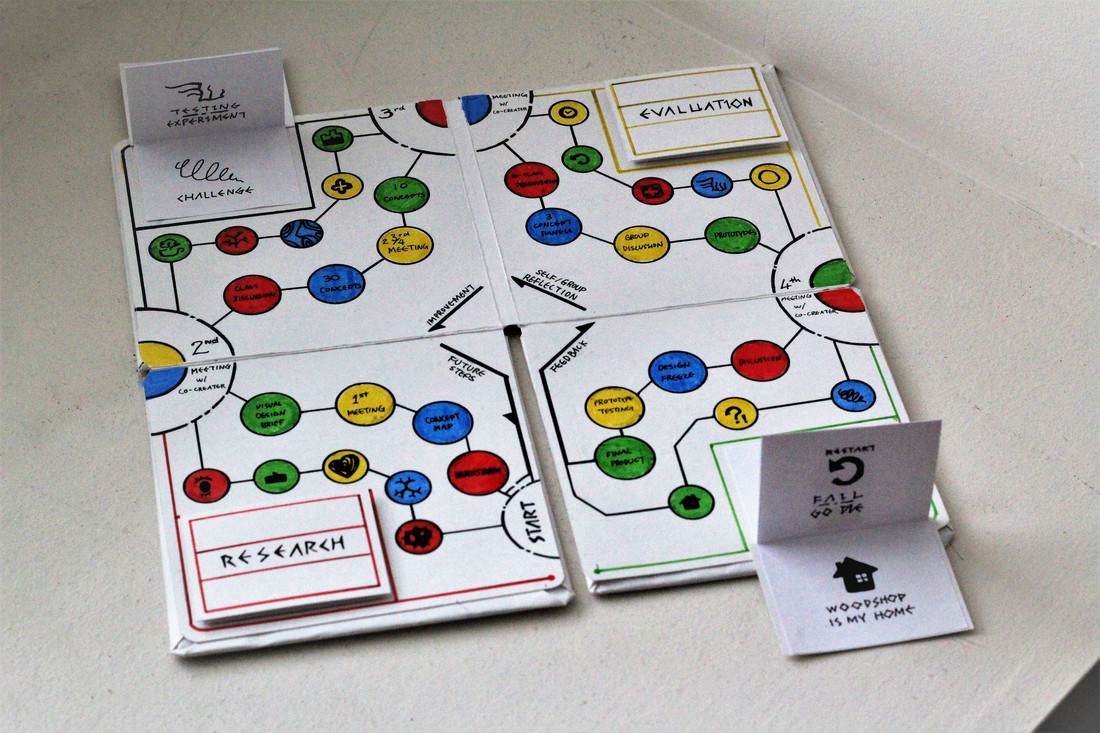
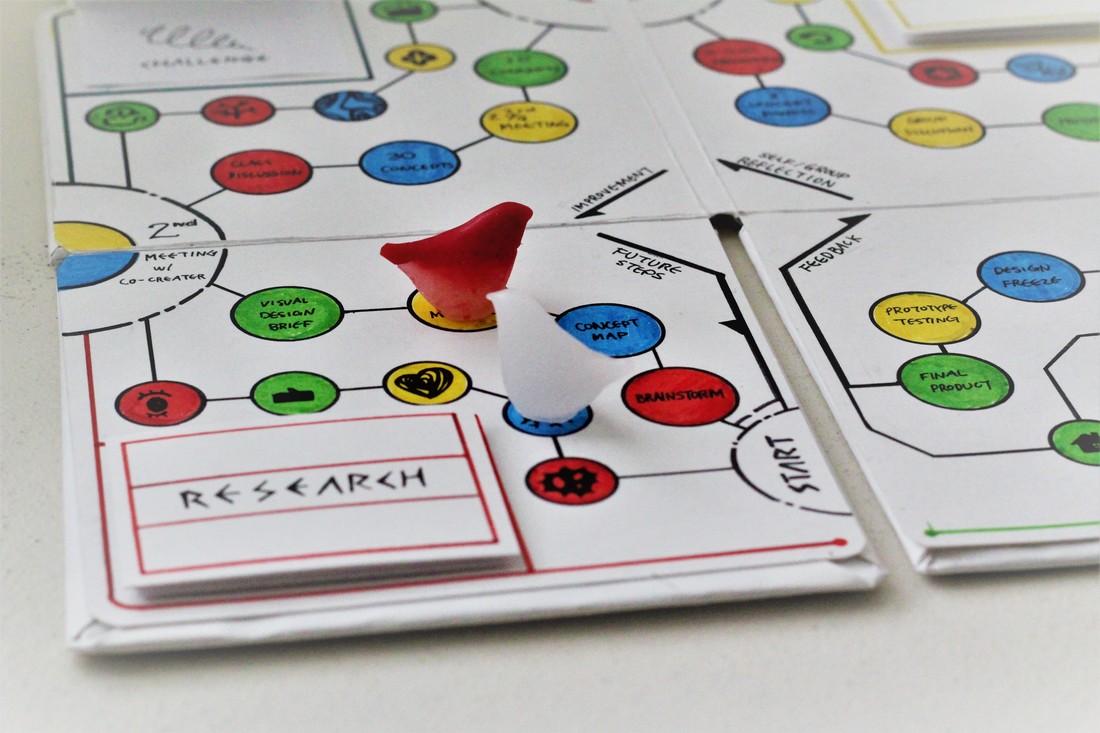
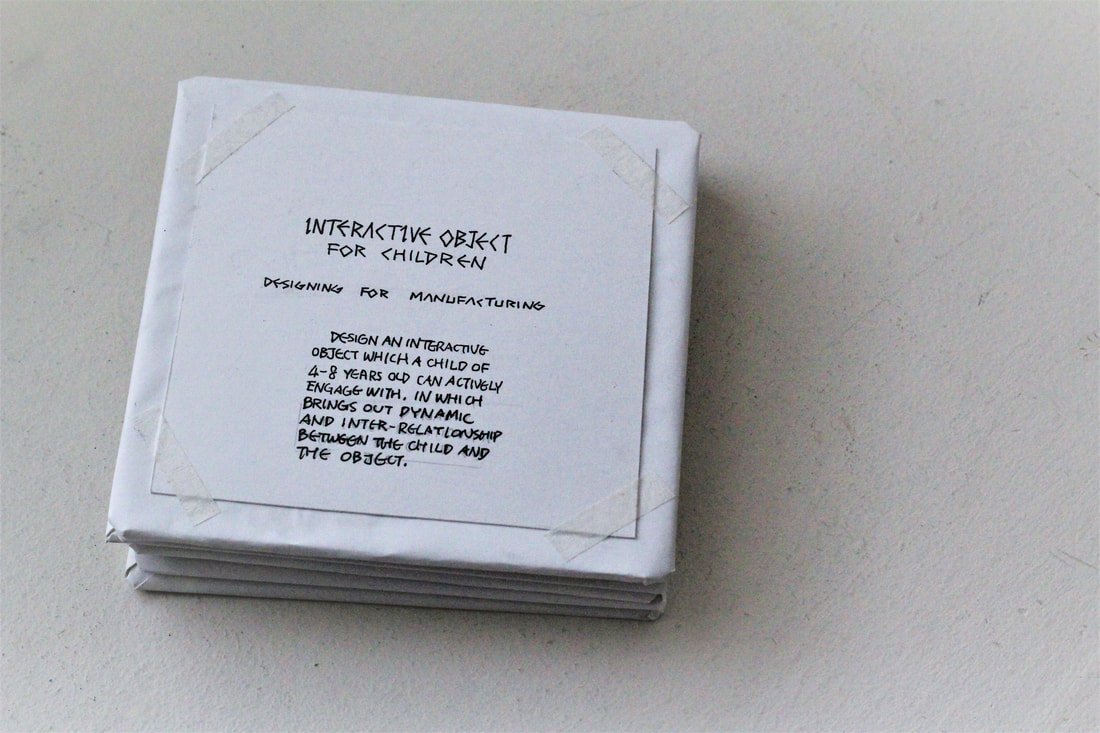
The map takes form as a board game, which embrace the fact that the project it represents is interactive and has this notion of gamification. The two characters stand for my co-designer and myself. As they are placed on certain palette, it indicates the stage of process each person at. Which would be quite useful as a way of communicate in a team. |
|
|
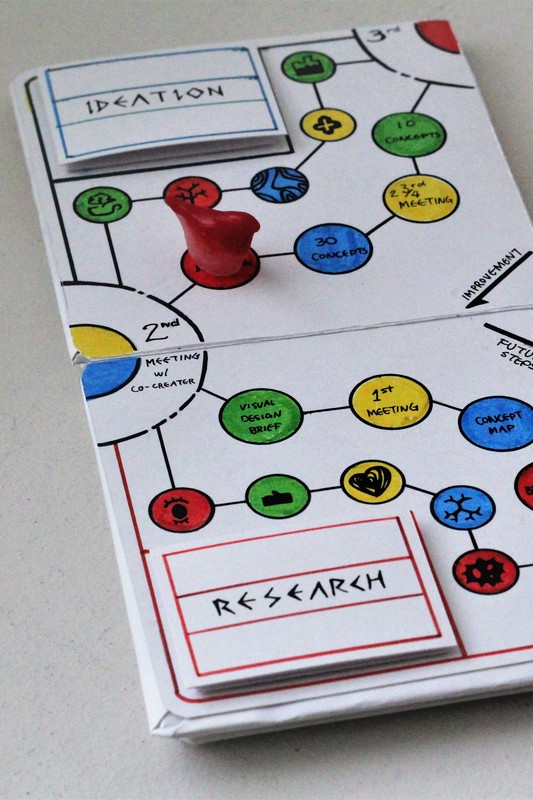
Each icon and color has its co-related meaning, which is explained at each corner. The category divides into four sections, which emphasis different steps of the design process:
1. Research (observe / learn / explore / document) 2. Ideation (generate/visualize/testing/challenge) 3. Evaluation (simplify / timing / positive / emotion) 4. Manufacture (coffee break/refine/ produce/ fail/ restart/ living in woodshop) |

|
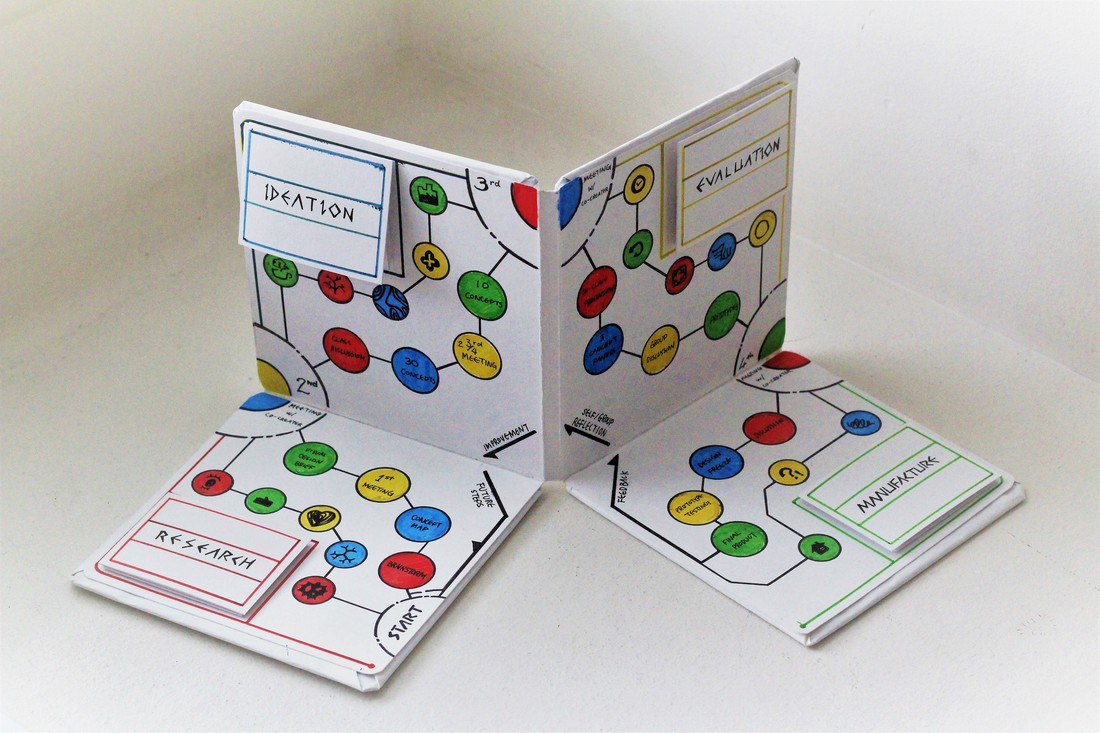
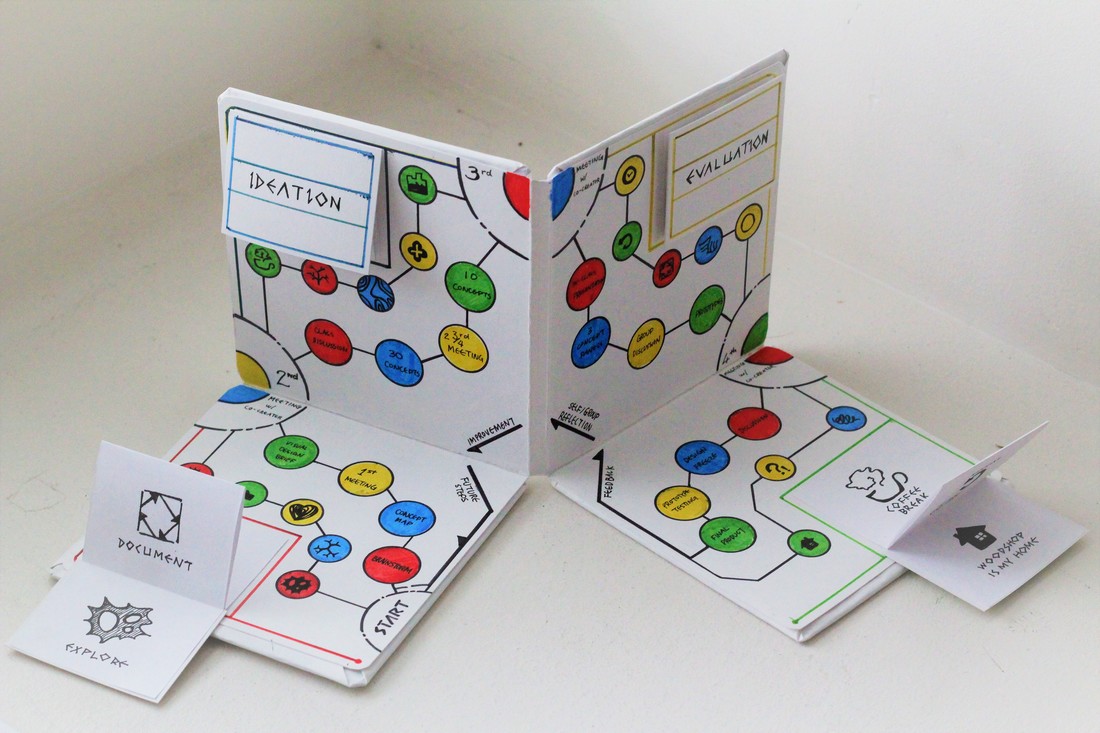
The value of this visual process map is that it constantly reminds me to go back to my core/initial intent (which I usually forgot when I was working on the project). The other substantial elements are, for example, it could go 3 dimension, which visually creates a stronger message for the users. Another is its foldability, being able to fold, not only does it decreases the storing size, but also increases the amount of usage space on the back as well.
|
